Environmentally Conscious Business Management
OUTPUT
Prevention of Air Pollution
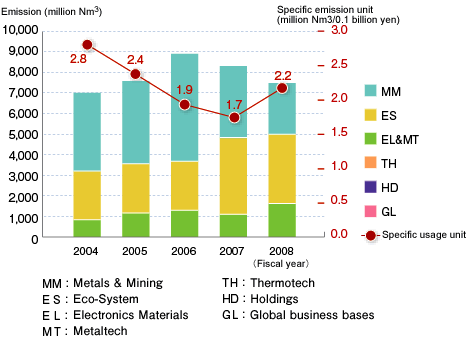
Exhaust emissions in 2008 was 7.472 billion m3 (7.461 billion m3 in Japan and 10.5 million m3 outside of Japan), which was a decrease of about 10% compared to last year domestically.
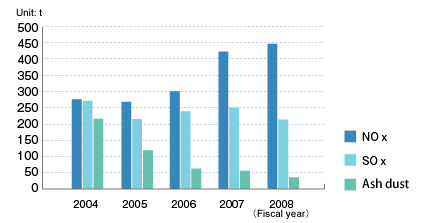
Emission of nitrogen oxide domestically increased by 6.2% compared to last year, while sulfur oxide and ash dust also decreased compared to last year.
Prevention of Water Pollution
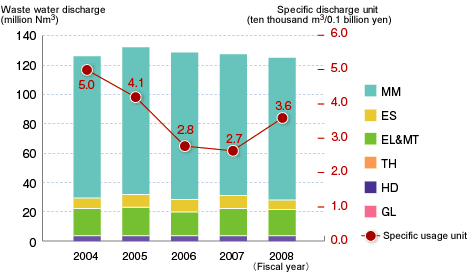
Quantity of waste water discharge in 2008 was about 125 million m3 (125 million m3 in Japan and 3,300 m3 outside of Japan).
To protect water resources, we strive to reduce waste water discharge by promoting recycling of water and process improvement, which has resulted in about 2.2% decrease of discharged water in 2008 compared to last year.
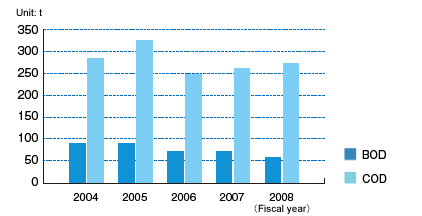
Emission of BOD (biochemical oxygen demand) in Japan decreased by 24% compared to last year, while COD (chemical oxygen demand) increased by 4.2%.
Control of Chemical Substances (those targeted for PRTR)
We endeavor to reduce disposal of substances targeted by the PRTR (Pollutant Release and Transfer Register) law in each of our plants, based on the law concerning assessing the discharged amount of special chemical substances and promotion of improving their management.
In 2008 we improved the processes in Kosaka Smelting and Refining, significantly reducing the amount of antimony, lead and arsenic.
Unit:
| Cabinet order no. | Name of Class I chemical substances | Discharged amount | Transferred amount | ||||
|---|---|---|---|---|---|---|---|
| Atmosphere | Water area | Soil | Landfill within our own property | Sewage system | Outside of each business establishment | ||
| 1 | Water-soluble compounds of zinc |
- | 6 | - | - | - | 26 |
| 16 | 2- amino ethanol | - | - | - | - | - | 0.3 |
| 25 | Antimony and its compounds |
0.1 | 0.3 | - | 120 | - | 1 |
| 43 | Ethylene glycol | - | 0.05 | - | - | - | 5 |
| 47 | Ethylenediaminetetraacetate | - | 0.1 | - | - | - | 22 |
| 60 | Cadmium and its compounds |
0.03 | 0.04 | - | 71 | - | - |
| 63 | Xylene | 0.3 | - | - | - | - | 7 |
| 64 | Silver and its water-soluble compounds |
0.1 | 0.1 | - | 7 | - | 0.2 |
| 68 | Chrome and trivalent chrome compounds | - | - | - | 4 | - | 1 |
| 85 | R-22 | - | - | - | - | - | 4 |
| 89 | Toluene | 5 | - | - | - | - | - |
| 100 | Cobalt | - | - | - | - | - | 4 |
| 108 | Inorganic cyanogen compounds | - | - | - | - | - | 0.01 |
| 121 | R-12 | - | - | - | - | - | 3 |
| 175 | Mercury and its compounds | - | 0.0003 | - | 1 | - | - |
| 178 | Selenium and its compounds | 0.1 | 0.2 | - | 10 | - | - |
| 198 | 1.1.5.7- tetraazatricyclo | - | 0.04 | - | - | - | 225 |
| 207 | Water-soluble copper salt | - | 0.4 | - | - | - | 22 |
| 217 | R-11 | - | - | - | - | - | 9 |
| 227 | Toluene | - | - | - | - | - | 10 |
| 230 | Lead and its compounds | 0.3 | 0.01 | - | 1,100 | - | 31 |
| 231 | Nickel | - | 0.02 | - | - | - | 58 |
| 232 | Nickel compounds | - | - | - | - | - | 0.02 |
| 243 | Barium compounds | - | - | - | - | - | 16 |
| 252 | Arsenic and its inorganic compounds |
0.1 | 0.01 | - | 665 | - | 2 |
| 253 | Hydrazine | - | - | - | - | - | 1 |
| 283 | Hydrogen fluoride and its water-soluble salt |
1 | 28 | - | - | - | - |
| 304 | Boron and its compounds | - | 7 | - | - | - | 11 |
| 311 | Manganese and its compounds |
- | 7 | - | - | - | 1.028 |
| Unit:mg-TEQ | |||||||
| 179 | Dioxine | 0.07 | 0.004 | - | - | - | 14.03 |
Our Main Efforts towards Proper Control and Reduction of the Substances Targeted for the PRTR
- To set up and manage voluntary control standards that are stricter than the legal standards (Eco-System Sanyo)
- To reduce lead by switching to production methods/processes that discharge less substances targeted for the PRTR (New Nippon Brass)
Wastes
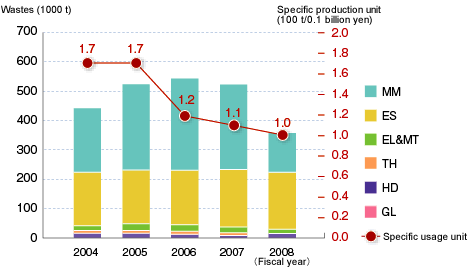
2008NWastes generated in 2008 were about 359,000 t (359,000 t in Japan and 0.1 t outside Japan), a decrease of 32% compared to last year. This is due to significant decrease of slag as a result of installation of a new smelting and refining facilities in Kosaka Smelting and Refining.
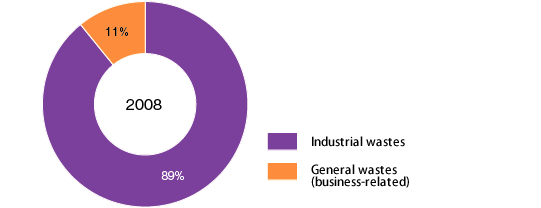
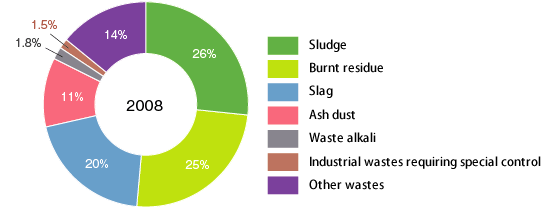
Wastes consisted of 89% of industrial wastes and 11% of general wastes (business-related). Industrial wastes mainly consisted of sludge (26%), burnt residues (25%), slag (20%) and ash dust (11%). We strive to make improvement and changes by recycling byproducts from our production processes, improving processes and yields as part of our efforts to reduce wastes.
Recycling
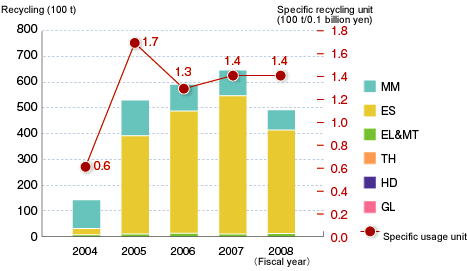
In 2008, volume of recycling amounted to 495,000 t (495,000 t in Japan and 0.6 t outside Japan), a decrease by about 23% in Japan compared to last year. This is mainly due to the decreased disposed soil or iron scraps.
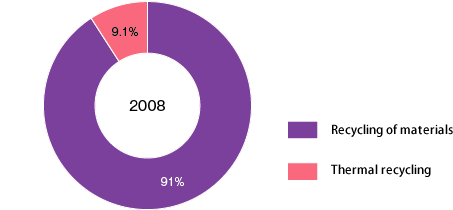
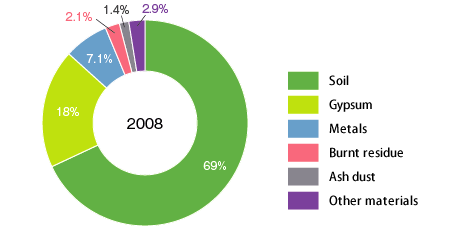
Recycling consisted of recycling of materials (91%) and thermal recycling (9.1%). The materials recycled were mainly soil (69%), gypsum (18%) and metals (7.1%). Thermal recycling consisted of shredded dust (71%) and waste plastics (7.9%).
Greenhouse gases
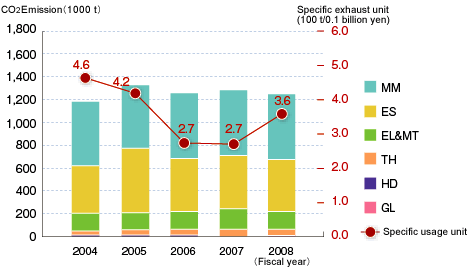
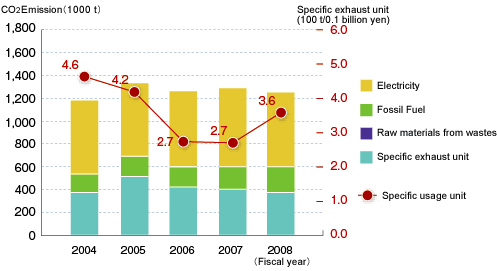
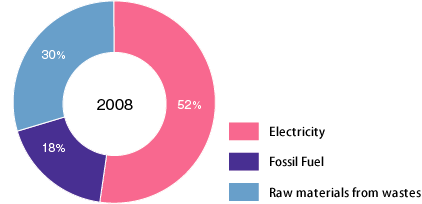
Emission of greenhouse gases from the entire DOWA group in 2008 was 1.246 million t (1.239 million t in Japan and 7,300 t outside Japan), a decrease of 3.3% domestically compared to last year, while specific emission per sale increased due to the metal price drop.
DOWA Metal Mine has the largest emissions and the next is DOWA ECO-System sharing a large amount of emissions.
On the other hand, greenhous gas is mainly through electricity consumption, accounting for 52% of all emissions.
Emission of CO2 generated from incineration of wastes from outside sources in connection with the environmental business activities accounts for a large amount of our emissions. Annual CO2 emissions caused by wastes from outside sources accounts for 400,000 t since 2004. This type of emission is very difficult to control on the entrusted side. Therefore, we strive to promote thermal recycling using heat generated from burning wastes and use the steam generated for effective use of recycled energy.
We also eliminate ozone-destroying CFC and other CFC substitutes including HFC and PFC that cause global warming, while utilizing the heat generated from burning these wastes. We are also promoting installation of invertors in machines and processes we use, switching part of the fuel we use to natural gas, and introducing of solar power generation equipment.
Furthermore, we encourage modal-shifting of transport to railways and vessels that emit less CO2, more effective collection and delivery of shipments and introduction of low emission vehicles.
¡Basis for Calculations
Emission factor set forth in the Act on Promotion of Global Warming Countermeasures is used in calculating carbon-dioxide emissions. CO2 emissions derived from wastes are calculated by accepted volume multiplied by the emission factor according to each categories set forth in the Wastes Disposal and Public Cleaning Law. As an emission factor for power generation 0.555 kg CO2/kWh is used, which is a national uniform emission factor set forth in the Act on Promotion of Global Warming Countermeasures. As a result, the figures may differ from those in the Dowa Group Report submitted to administration authorities.
Our Efforts towards Prevention of Global Warming
| Energy saving activities | üControl of the output and RPMs of equipment@@ üProduction system@@@ üImprovement of production efficiency üSwitching to high-efficiency lighting equipment üIntroduction of the control by inverter@@ üImplementation of power generation from wastes. |
|---|---|
| Introduction of renewable energy | üSolar power generation |
| Switching to energy that produces less greenhouse effect | üSwitching from LPG to electricity üSwitching from gasoline and Bunker A fuel to natural gas |
| Activities related to transportation | üSwitching to transportation by ship or railways üMore efficient collection and delivery üIntroduction of low emission vehicles (electric, hybrid and low fuel efficient vehicles) |
| Other efforts around our workplaces | üHeat insulating coating on the roofs of plants üTurning light off when nobody is there and conduct energy-saving patrols üControl of air conditioning temperature settings üStop engine idling |
Topics
Measures to Fight Global Warming Together!
 In-house manual
¡Participating in gTeam Minus 6%h
The DOWA group participated in the national movement of gTeam Minus 6%h, aimed at achieving the goal set by the Kyoto Protocol in June 2008.
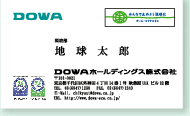
In addition to temperature control of air conditioning and implementation of Cool Biz, we use the logo of gTeam Minus 6%h on our business cards or brochures to remind people inside and outside our companies of global warming.
¡DOWA ECO-FAMILY
Employees and their families of The DOWA group are committed to fight global warming together. We registered on ECO-FAMILY.JP, the website of an initiative by the Ministry of Environment who has been working as a team since October 2008. Through in-house social occasions and newsletters, we encourage employees and their family members to actively cooperate for environmentally-conscious activities, energy saving and reduction of CO2 at home.
* ECO-FAMILY
http://www.eco-family.go.jp/index.html