ESG Library
The Environment
Scope of Reporting Environmental Data
The scope of reporting environmental data includes the Company and its consolidated subsidiaries and others * (66 companies in total). For details, please refer to the following link.
*The scope also includes UNEKURA MINING CO., LTD., which is highly relevant to the Company’s business.
Environmental Management
Environmental Management System
Status of Environmental Management System Certification
Approximately 75% of the Group’s major production bases have established an environmental management system (EMS) structure for environmental management.
(Unit : Locations)
| Certification | Domestic | Overseas |
|---|---|---|
| ISO14001 | 30 | 14 |
| Eco-Action 21 | 7 | 0 |
| Green Management Certification | 1 | 0 |
| Total | 52 | |
Material Balance
INPUT
| Unit | FY2019 | FY2020 | FY2021 | FY2022 | Year-on-Year | |||
|---|---|---|---|---|---|---|---|---|
| INPUT | Total energy input | PJ | 18 | 17 | 18 | 17 | ▲3% | |
| Fossil fuel consumption | Thousand kL | 121 | 113 | 115 | 108 | |||
| Purchased electric power | GWh | 1,352 | 1,305 | 1,358 | 1,333 | |||
| Thermal power generation | GWh | 5 | 1 | 1 | 1 | |||
| Biomass power generation | MWh | – | – | 902 | 2,267 | |||
| Hydroelectric power generation | GWh | 39 | 48 | 73 | 69 | |||
| Solar power generation | MWh | 335 | 388 | 1,564 | 1,881 | |||
| Purchased steam flow | GJ | 388 | 300 | 98 | 0 | |||
| Water resources | Million m3 | 106 | 100 | 103 | 101 | ▲2% | ||
| Seawater | Million m3 | 93 | 88 | 90 | 89 | |||
| Besides seawater | Million m3 | 13 | 13 | 13 | 12 | ▲7% | ||
| Raw material use | Thousand tons | 1,058 | 972 | 1,089 | 1,041 | ▲4% | ||
| Raw materials | Thousand tons | 806 | 715 | 807 | 783 | |||
| Auxiliary materials | Thousand tons | 162 | 179 | 192 | 173 | |||
| Heat treatment of items received | Thousand tons | 89 | 77 | 89 | 83 | |||
| Packaging materials | Thousand tons | 2 | 1 | 1 | 1 | |||
| Amount of waste received | Thousand tons | 1,556 | 1,440 | 1,590 | 1,680 | 6% | ||
| Waste | Thousand tons | 1,420 | 1,304 | 1,476 | 1,557 | |||
| Statutory recycled items received | Thousand tons | 96 | 98 | 74 | 93 | |||
| Contaminated soil | Thousand tons | 40 | 38 | 40 | 29 | |||
| Fluorocarbon throughput | tons | 552 | 604 | 779 | 917 | |||
The DOWA Group Business Activities
| Unit | FY2019 | FY2020 | FY2021 | FY2022 | Year-on-Year | ||
|---|---|---|---|---|---|---|---|
| Within business areas | Waste heat power generation | GWh | 83 | 80 | 98 | 87 | ▲11% |
| Waste heat utilization | TJ | 427 | 443 | 1,007 | 934 | ▲7% | |
OUTPUT
| Unit | FY2019 | FY2020 | FY2021 | FY2022 | Year-on-Year | |||||
|---|---|---|---|---|---|---|---|---|---|---|
| OUT PUT |
Total greenhouse gas emissions | Thousand tons-CO2 | 1,903 | 1,815 | 1,724 | 1,713 | ▲1% | |||
| Electric power source | Thousand tons-CO2 | 714 | 678 | 659 | 674 | |||||
| Fossil fuel source | Thousand tons-CO2 | 330 | 314 | 326 | 313 | |||||
| Waste source | Thousand tons-CO2 | 860 | 823 | 738 | 726 | |||||
| Amount of electric energy sold | GWh | 0.8 | 1.2 | 1.8 | 3.0 | 67% | ||||
| Product quantity | Thousand tons | 945 | 886 | 965 | 928 | ▲4% | ||||
| Chemical substance emissions | tons | 1,773 | 1,542 | 1,489 | 1,526 | 3% | ||||
| Drainage water discharge | Million m3 | 117 | 114 | 100 | 99 | ▲1% | ||||
| Excluding seawater | Million m3 | 24 | 27 | 11 | 11 | 1% | ||||
| Recycling and waste amount | Thousand tons | 1,001 | 1,086 | 1,040 | 1,029 | |||||
| Recycled amount | Thousand tons | 634 | 612 | 645 | 638 | ▲1% | ||||
| Thermal recycling | Thousand tons | 352 | 344 | 353 | 352 | ▲0% | ||||
| inside the Group | Thousand tons | 45 | 45 | 41 | ||||||
| outside the Group | Thousand tons | 299 | 309 | 311 | ||||||
| Material recycling | Thousand tons | 282 | 269 | 291 | 286 | ▲2% | ||||
| inside the Group | Thousand tons | 180 | 200 | 192 | ||||||
| outside the Group | Thousand tons | 89 | 91 | 93 | ||||||
| Waste generated | Thousand tons | 367 | 473 | 396 | 391 | ▲1% | ||||
Note:
- With regard to CO2 emissions, in principle the DOWA Group seeks to multiply amounts of electricity purchased, fossil fuel consumed, and waste received by the emission factor put forth in the Law Concerning the Promotion of Measures to Cope with Global Warming.
- Regarding CO2 emissions derived from waste received, because the calculation terms are as of the time this report was prepared, numbers may not necessarily match those reported to government agencies, which are calculated at a different time.
- Due to differences in the classification of waste in Japan and overseas and to the difficulty in setting an appropriate emission factor for waste received at overseas business sites, only the portion of CO2 emissions originating from waste from domestic business locations is given.
- The figures reported in DOWA REPORT 2022 have been partially revised due to a review in tabulation.
Atmosphere and Water Management
Status of Management Targets for Reducing Environmental Impact
(Unit : Locations)
| Management Objectives Based on Agreements with Local Governments | Self-Imposed Management Goal | |
|---|---|---|
| Atmosphere | 5 | 13 |
| Water management | 3 | 18 |
Trend in Atmospheric Emissions by Substance
(Unit:tons)
| Item | FY2020 | FY2021 | FY2022 |
|---|---|---|---|
| HCI | 25 | 39 | 36 |
| NOx | 439 | 480 | 530 |
| SOx | 163 | 124 | 150 |
| Soot and dust | 39 | 33 | 25 |
Trend in Water Emissions by Substance
(Unit : tons)
| Item | FY2020 | FY2021 | FY2022 |
|---|---|---|---|
| COD | 360 | 423 | 222 |
| BOD | 66 | 50 | 52 |
Conservation of Environment
Managing the Use of Water Resources
Water Resources
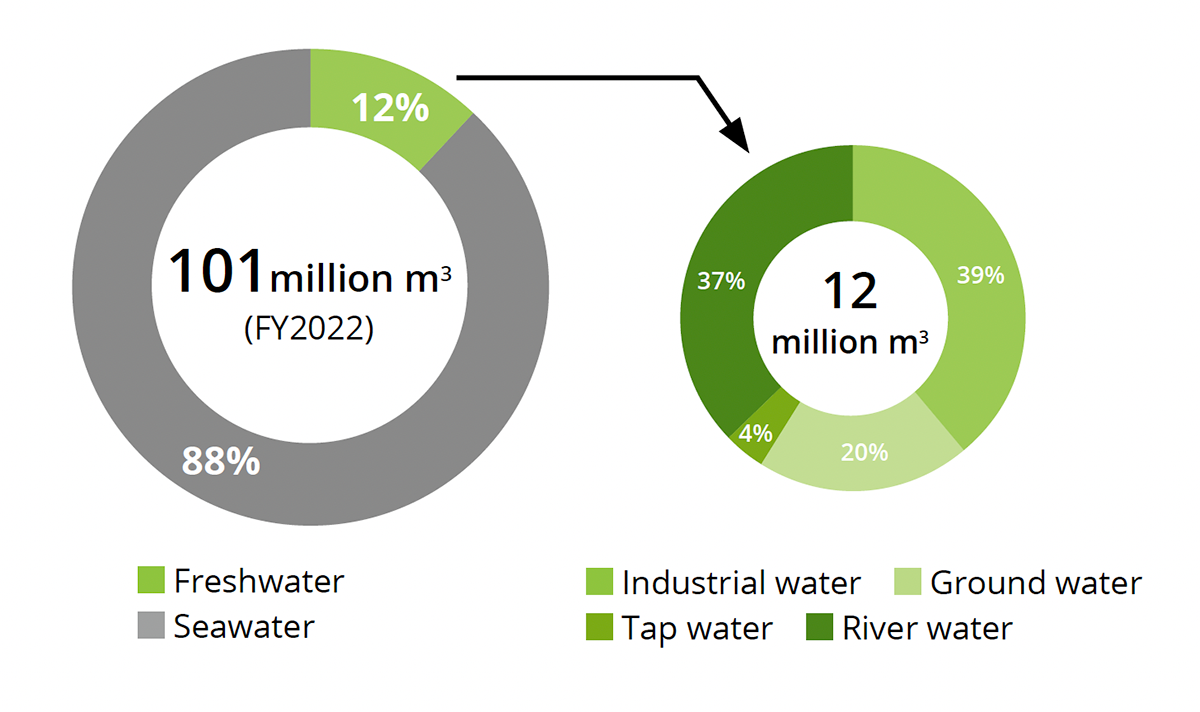
The water input was 101 million m3 in FY2022. Efforts to reduce water consumption through the recycling of process water and thorough water conservation resulted in a decrease in the use of seawater used as cooling water, resulting in an overall decrease of approximately 2% compared to the previous year. Freshwater consumption amounted to 12 million m3, or just over 10% of total water consumption, a decrease of 7% on the previous year.
Water Resources
Freshwater Usage (Quantity of Water Intake)
(Unit : Million m3)
| FY2020 | FY2021 | FY2022 | |
|---|---|---|---|
| River water | 4.8 | 4.9 | 4.4 |
| Industrial water | 4.6 | 4.7 | 4.7 |
| Ground water | 2.8 | 2.8 | 2.5 |
| Tap water | 0.4 | 0.5 | 0.5 |
| Total | 12.7 | 12.9 | 12.1 |
Drainage Water
Total drainage in FY 2022 was 99 million m3, about the same amount as in FY 2021.
Initiatives to Reduce Water Withdrawals and Reduction Amount in FY 2022
(Unit : m3)
| Initiatives | Reduction Amount |
|---|---|
| Reduction through intensity management | 2,300 |
| Reduction through in-process water reuse | 10,000 |
| Reduction through the use of rainwater in environmental measures | 16,432 |
Climate Change
Greenhouse Gas Emissions
Amount of Contribution to GHG Emissions Reduction in Society through DOWA Green Action
(Unit : Thousand tons-CO2)
| FY2018 | FY2019 | FY2020 | FY2021 | FY2022 | |
|---|---|---|---|---|---|
| Contribution to CO2 Emissions Reduction through Fluorocarbon Treatment | 1,080 | 1,027 | 1,048 | 1,464 | 1,538 |
Trend in CO2 Emissions
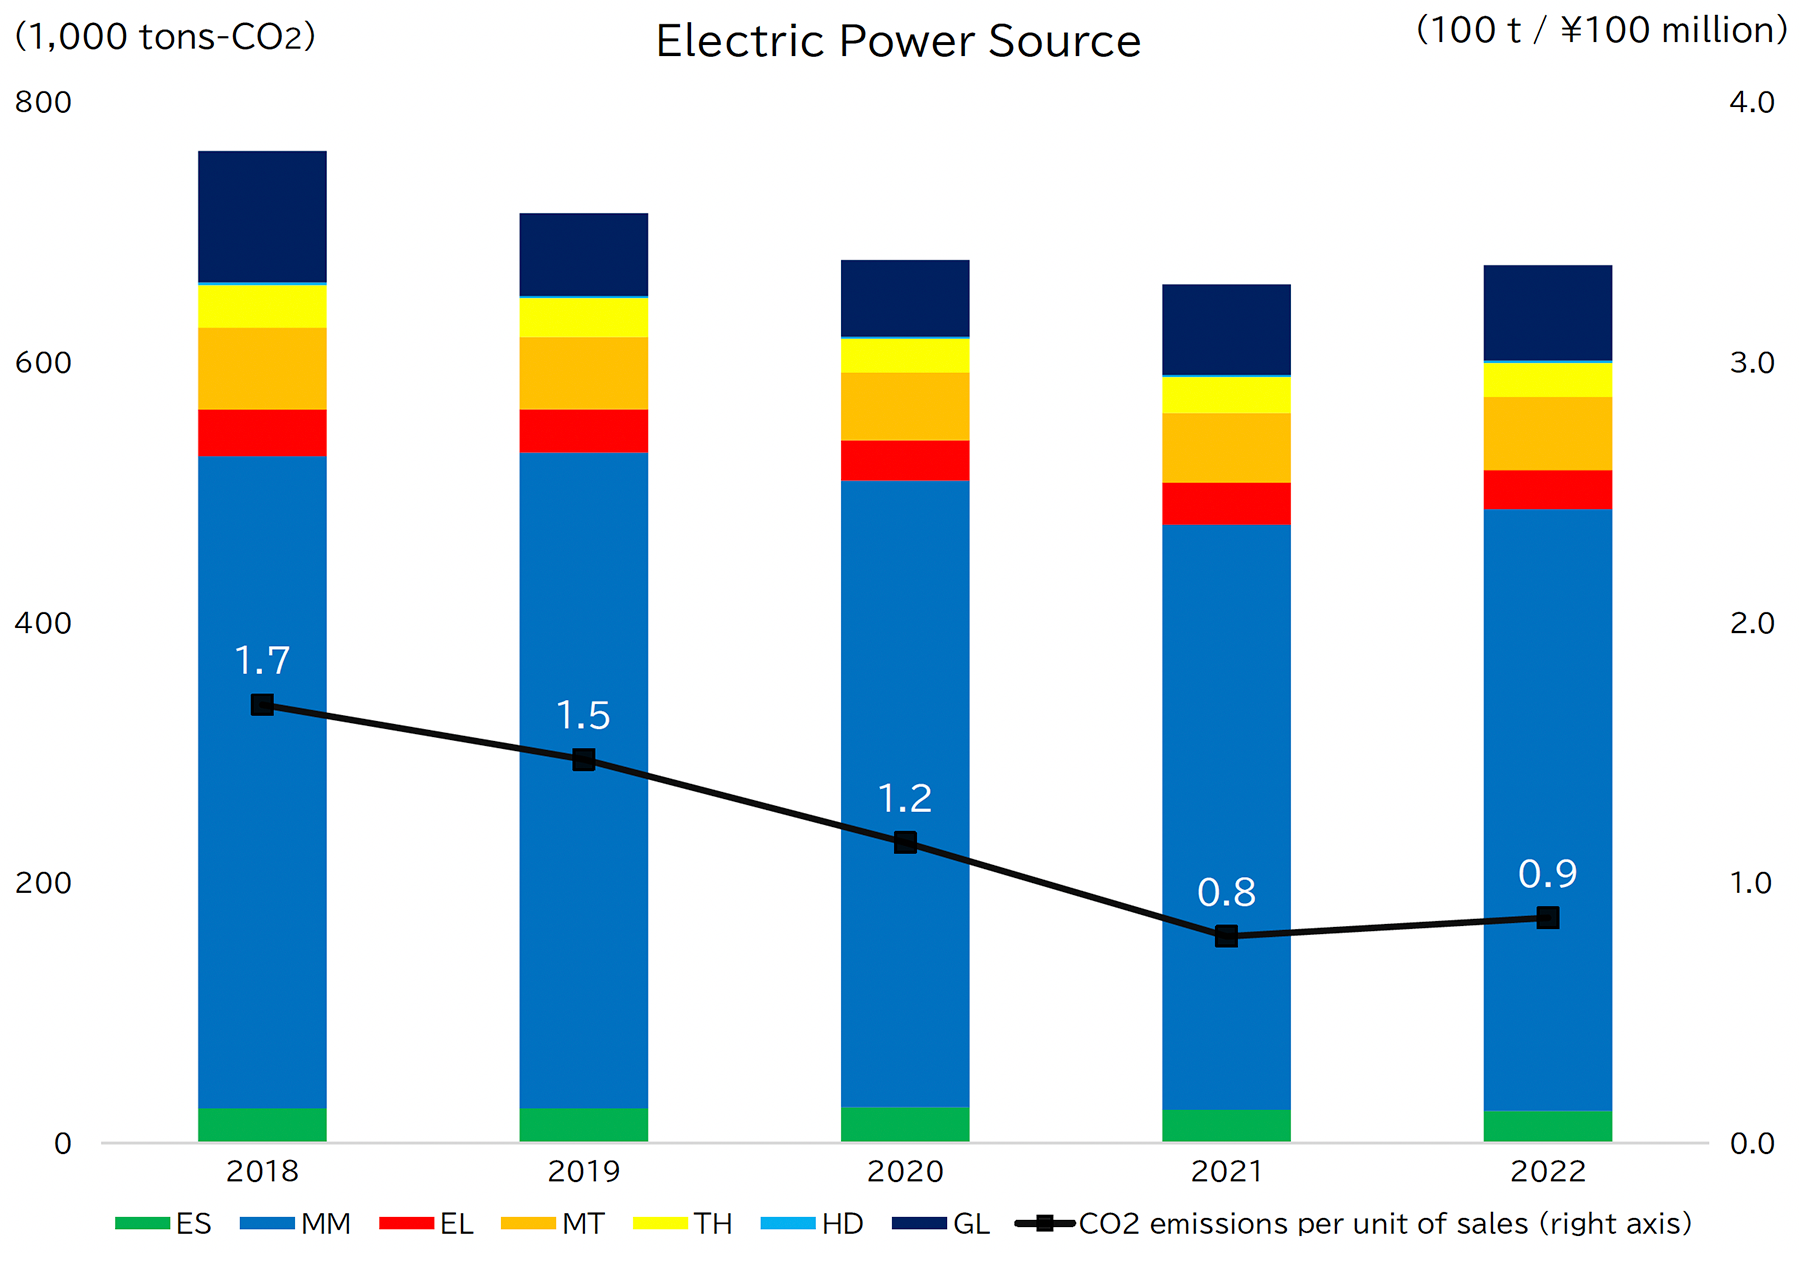
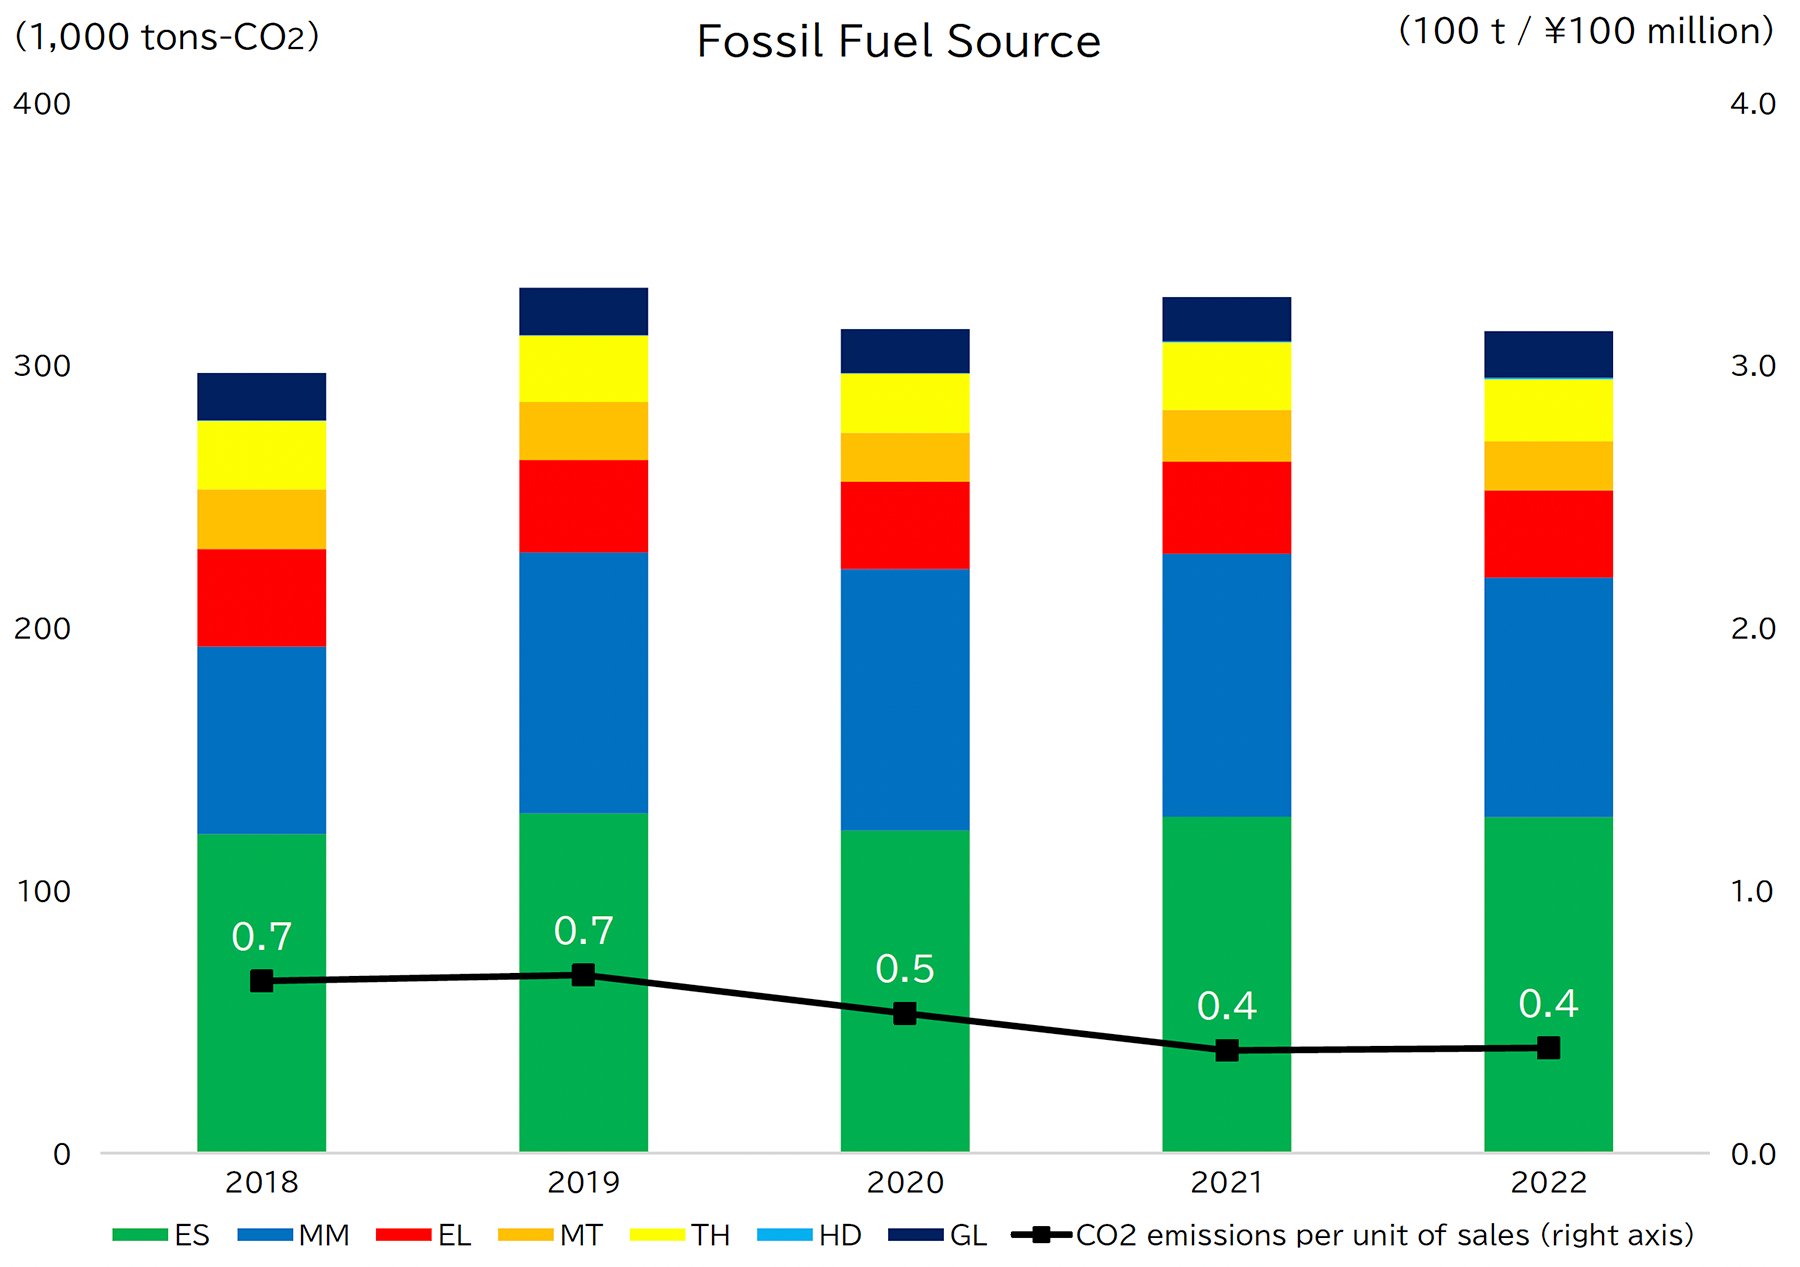
Group-wide greenhouse gas emissions in FY 2022 were approximately 1,713 thousand tons of CO2, a decrease of 1% from FY 2021. Total energy use in FY 2022 decreased by about 3%, particularly in using high-calorie waste as a heat source to reduce fossil fuel use. On the other hand, although electricity consumption decreased, CO2 emissions from electricity increased slightly due to changes in emission coefficients.
(Unit : Thousand tons-CO2)
| FY2018 | FY2019 | FY2020 | FY2021 | FY2022 | ||
|---|---|---|---|---|---|---|
| Scope1 | From fossil fuels | 297.2 | 329.6 | 313.9 | 326.1 | 313.1 |
| From waste | 876.2 | 859.7 | 822.9 | 738.2 | 725.9 | |
| Scope2 | From electricity | 762.1 | 714.1 | 678.1 | 659.5 | 674.4 |
| Total CO2 emissions | 1,935.5 | 1,903.4 | 1,814.9 | 1,723.8 | 1,713.4 | |
(*) Coverage of 90% or higher, location-based
Electric Power Source
Electric Power Source
Fossil Fuel Source
Fossil Fuel Source
Note : Above figures use the following abbreviations.
HD: DOWA Holdings Co., Ltd.; ES: Environmental Management & Recycling Business; MM: Nonferrous Metals Business; EL: Electronic Materials Business; MT: Metal Processing Business; TH: Heat Treatment Business; GL: Global Business
Utilization of Natural Energies
Hydroelectric Power Generation
In FY 2022, these power plants generated 68.8 GWh of electricity.
Solar Power Generation
In FY 2022, a total of 1,881 MWh of electricity was generated through solar power.
Biomass Power Generation
In FY 2022, we generated 2,267 MWh of electricity through biomass power.
Waste Heat Power Generation
We generated 87 GWh of waste heat power in FY 2022.
Resource Recycling
INPUT
Raw Materials
In FY 2022, raw material use amounted to 1,041 thousand tons, a year-on-year increase of approximately 4%. Of this, approximately 24% was recycled raw materials.
Waste Received
In FY 2022, the amount of waste received came to 1,680 thousand tons, of which approximately 88% was waste received from outside the Group. This was an increase of about 6.6% compared to the previous year.
OUTPUT
Recycling
In FY 2022, thermal recycling amounted to 352 thousand tons, almost the same as in the previous year, while material recycling totaled 286 thousand tons, a contraction of approximately 2%.
Waste Generated
In FY 2022, the amount of waste disposed of was 391 thousand tons, which is almost the same as in the previous year.
The volume of waste discharged includes incineration residue and other residues generated after contracted treatment in our main business of waste disposal.
(Unit : Thousand tons)
| FY2020 | FY2021 | FY2022 | ||
|---|---|---|---|---|
| Domestic | 427.3 | 378.2 | 378.0 | |
| Overseas | 46.0 | 17.6 | 12.7 | |
| Total | 473.3 | 395.9 | 390.7 | |
| Slag | 85.6 | 88.5 | 90.4 | |
| Hazardous waste* | 9.1 | 10.1 | 11.6 | |
*Hazardous waste…Refers to waste as defined by the laws of each country. In Japan, it refers to specially-controlled industrial waste.