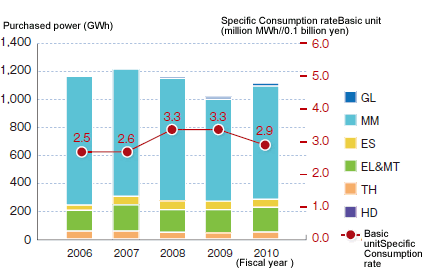
Although some of our operating companies were forced to stop operations due to the Great East Japan Earthquake, our consumption of purchased power in 2010 increased to 1,115GWh (1,093GWh in Japan and 22GWh outside Japan). This is 10% increase compared to last yearr, mainly due to recovery of operations in Akita Zinc.
In-house power generation totaled to 123GWh, of which 1GWh was from thermal power, 68GWh from waste heat and 54.8GWh from renewable energy (54.7GWh hydro and 173 MWh solar). This in-house power generation includes the supply of power from our products and manufacturing business to our environmental business in Okayama area. In 2010 power generation from waste heat in Eco-System Chiba was four times as much as power supplied from outside and our photovoltaic generation increased by 28 MWh, which corresponds to total annual power consumption of 50 households.
[Changes of Annual Purchased Power Consumption]
Fossil fuel consumption in 2010 was 108,000 kL as converted to crude oil (104,000 kL in Japan and 3,500 kL abroad), an increase of 4% in Japan compared to the previous year. This was mainly due to the increase of the used oil we accepted as well as reclaimed oil and flame-retardant substances at Eco-System Chiba. Fuel gas use increased at DOWA IP Creation, DOWA Power Device and DOWA Hightech due to increased production. Fuel use by DOWA Tsu-un decreased to 2,700 kL due to the earthquake, 219 kL decrease from last year.
[Changes of Annual Fossil Fuel Consumption]
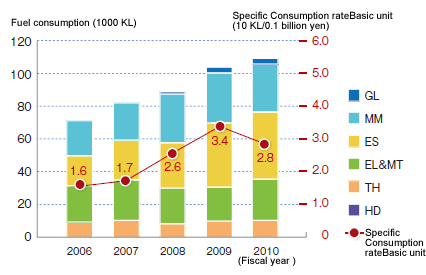
* Correction was made on the figures of used oil and reclaimed oil
consumption in past years in our environmental business in Japan.
Reduction of energy consumption and improvement of energy efficiency are absolutely necessary to reduce CO2 emission. The DOWA group is promoting such reduction and improvement through: utilization of renewable energy including hydro and solar power; switching to and introduction of energy saving equipment and facilities; and a modal shift of logistics.

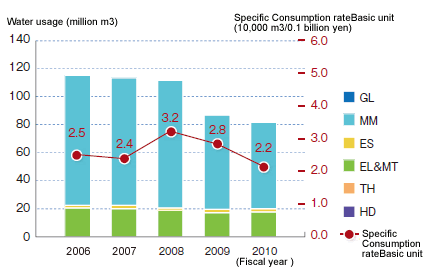
Water usage in 2010 consisted of purchased water of approximately 4.5 million m3 (4.3 million m3 in Japan and 0.2 million m3 abroad) and in-house intake of water of approximately 77.6 million m3 (in Japan, 0.1 million m3 abroad), totaling 82.1 million m3, a decrease of 6% compared to the previous year. Akita Zinc succeeded in increasing its cooling efficiency and reducing the number of ocean water pumps, contributing to the decrease of water usage across the DOWA group. Also in 2010, we achieved 5% reduction of water usage for processed zinc products, reduction of basic unit of pumped water in manufacturing of copper elongation products and reduction of well water usage in thermally processed products.
[Changes of Annual Usage of Water]
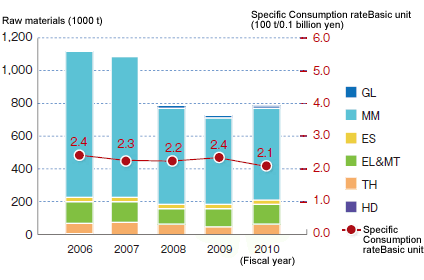
The DOWA group used 785,000 t of raw materials (for materials, medical agents, machine parts and packaging materials) in 2010. Materials used in Japan increased by 11%, compared to the previous year, corresponding to the similar level of two years ago. Usage of virgin materials in Japan was 679,000 t, while that of recycled materials was 91,000 t and entrusted goods for heat treatment was 56,000 t. Usage of raw materials (ores) increased in Akita Zinc and Akita Zinc Solutions compared to the previous year. Entrusted goods for heat treatment also increased in Ota Plant of DOWA Thermo Engineering, etc.
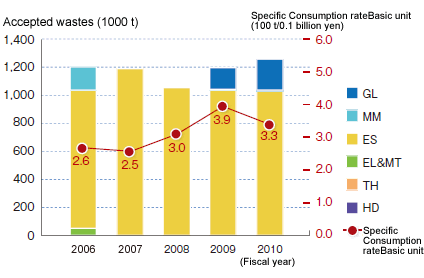
Accepted wastes in 2010 were 1,255,000 t (1,034,000 t in Japan and 221,000 t abroad). Accepted wastes in Japan decreased slightly compared to the previous year of 1,040,000 t. Accepted wastes in Japan include waste alkali, sludge, waste plastics, shurreded dust, soil, and waste alkali and used oil (both not subject to special control) increased by 21% and 19% respectively, while soil decreased by 36%.
< Annual Changes of Raw Materials Usage >
< Details of Raw Materials Usage >
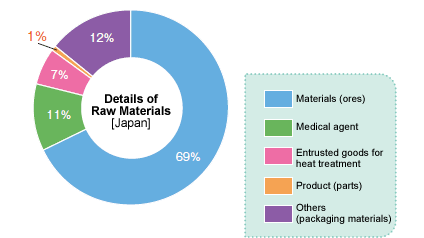
*As clasification of raw materials differs in Japan and outside Japan,
only those of business establishment in Japan are shown here.
< Changes of Quantity of Accepted Wastes >
< Details of Accepted Wastes >
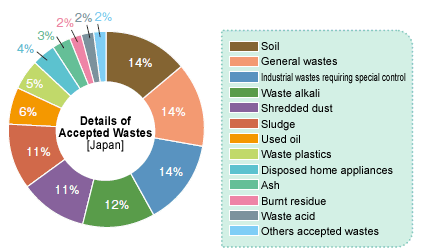
*As clasification of accepted wastes differs in Japan and outside Japan,
only those of business establishment in Japan are shown here.